
In today’s world, primers have become the primary tool for DNA synthesis in genomics laboratories, whether it’s for PCR or qPCR. In recent years, the importance of oligo-based assays has grown enormously. Besides their use in COVID-19 testing and disease diagnostics, oligo-based assays are becoming increasing popular in the fields of environment and food testing, as well as plant and animal breeding. This raises the important question of the optimum primer design to achieve the best possible results.

Key takeaways:
- PCR primers should have a length between 18 and 24 nucleotides, and probes between 15 to 30 nucleotides.
- The optimal melting temperature (Tm) of a primer is 54°C or higher. The annealing temperature (Ta) of a primer is often above its Tm (of 2-5°C).
- The GC content of a primer should be between 40% and 60%.
- Prevent primer-dimer and hairpin formation by using a reliable primer design tool and keeping the parameters “self-complementarity” and “self 3′-complementarity” low.
- The Eurofins Genomics tools reliably design the best suited PCR primers and qPCR probes
Certain guidelines are set for primers and probes to determine the success and quality of PCR and qPCR analysis (Rodríguez, Rodríguez, Córdoba, & Andrade, 2015). Experts may specify a suitable length, temperature, or GC content when designing primers and probes. You can navigate the design process by following the example of experienced professionals.
To help you succeed in all of your upcoming DNA analyses, we have boiled down our long-standing experience and knowledge in oligo synthesis and application to the following top five factors to consider for your primer and probe designs.
Difference between primers and probes
Primers are the starting point of the polymerase chain reaction (PCR) with single-stranded DNA/RNA. Primers are usually designed to bind to a specific DNA/RNA sequence. In the cell, RNA primers are the starting point of DNA replication.
qPCR probes describe DNA sequences similar to primers that are typically labelled with a fluorophore as signalling molecules (molecular marker). The use of these probes allows for the quantification of specific DNA sequences present in a sample (image 1).
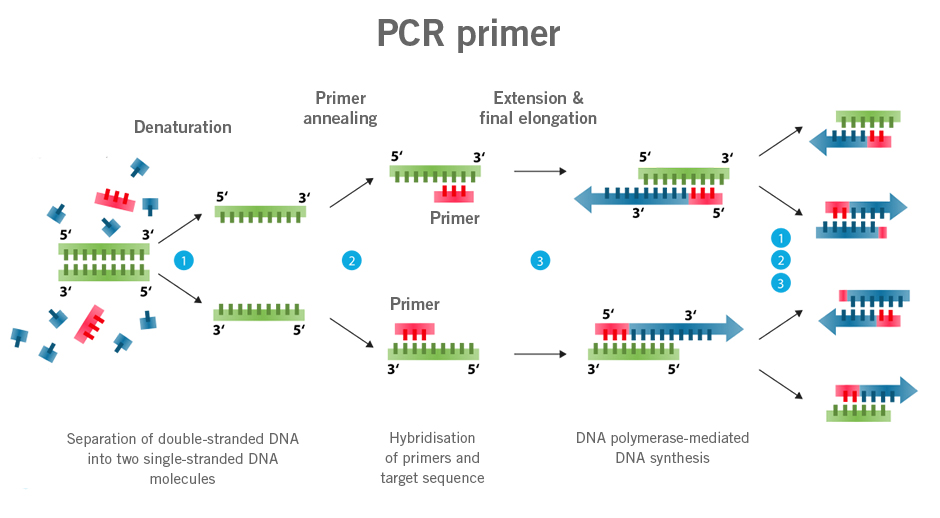
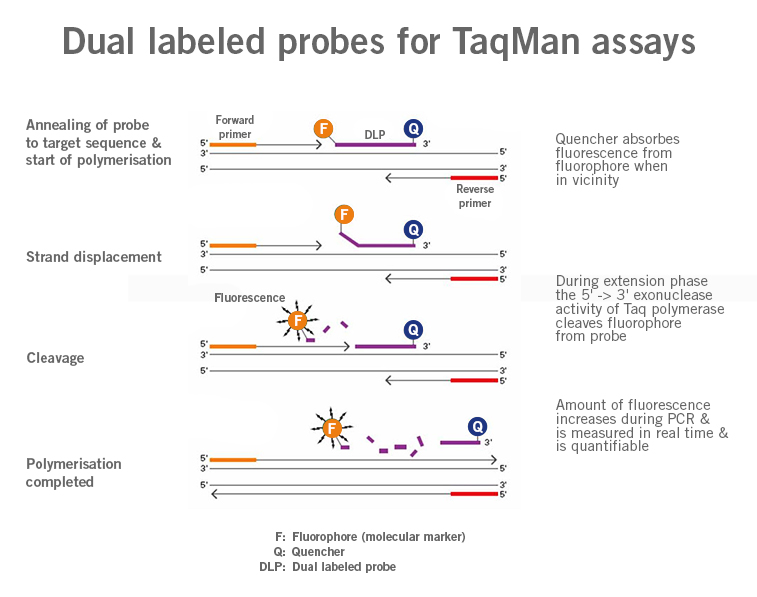
Image 1:Image 1: Depiction of difference in functioning of primers and probes (Dual Labeled Probes) (image source: https://commons.wikimedia.org/wiki/File:Polymerase_chain_reaction.svg?_ga=2.160191357.1310683390.1661437422-1752025030.1661437422, created by: Enzoklop, license: Creative Commons Attribution-Share Alike 3.0 Unported).
No. 1 primer design factor: Make sure it’s the right length
The specificity of a primer depends on its length.
Primers, such as PCR primers, should be designed with a length of 18 to 24 nucleotides for ideal amplification. Long primers have a slower hybridisation rate and a lower chance of annealing to the intended target sequence. Slower hybridisation produces inadequate specificity and inadequate binding to the target sequence, whereas faster hybridisation rates result in high target concentrations and maximum binding to the target sequence. The risk of a slower hybridisation increases when a primer is longer than 30 base pairs.
Even though long primers have a higher level of specificity than short primers, they are less efficient during the annealing phase and produce less amplicon yield. Due to the build-up of by-products and the loss of components necessary for DNA synthesis during a PCR, more cycles can result in less efficient outcomes. Short primers, however, anneal to their target sequence more effectively and need fewer PCR cycles for amplicon generation compared to long primers (Wu et al., 2010).
Sidenote:
To conduct a PCR analysis, scientists must have a specific primer that only amplifies the intended target. The primer may cause several unwanted amplifications if it matches to unintended sequences. Therefore, high specificity is desirable in any polymerase chain reaction.
Unlike primers, the optimal length of probes is highly target-specific. The length generally selected by experts is between 15 and 30 nucleotides. However, when longer probes are used instead of shorter ones, fewer probes per gene may be required (Haslam et al., 2008).
There are, of course, exceptions where primer and probe lengths need to be longer due to the target sequence and still perform very well with efficiencies that are not bad at all.
No. 2 primer design factor: Choose the optimal melting temperature (Tm) range
Melting temperature (Tm) plays an integral part in both PCR and qPCR experiments. This is the temperature at which the DNA duplex, commonly known as double-stranded DNA, splits into two single-stranded DNA parts.
Moreover, Tm also determines the annealing temperature Ta, where primer binding occurs at the highest efficiency and specificity. Ta affects the final amount of PCR and qPCR product yield.
The optimal melting temperature for maintenance of primer specificity is 54°C or higher (54°C to 65°C). However, Ta of a primer is often above its Tm, usually in a range of 2-5°C.
When a primer is designed, its Tm should not be above 65°C, as it increases the risk of secondary annealing (Dieffenbach, Lowe, & Dveksler, 1993).
During a PCR, Tm describes the temperature at which primers have annealed to 50% of the target sequences and the other 50 % of target sequences are free. Both states are in equilibrium (image 2).
The Tm of a PCR can vary based on buffer composition, metal ion concentration, pH, and additives such as DMSO.
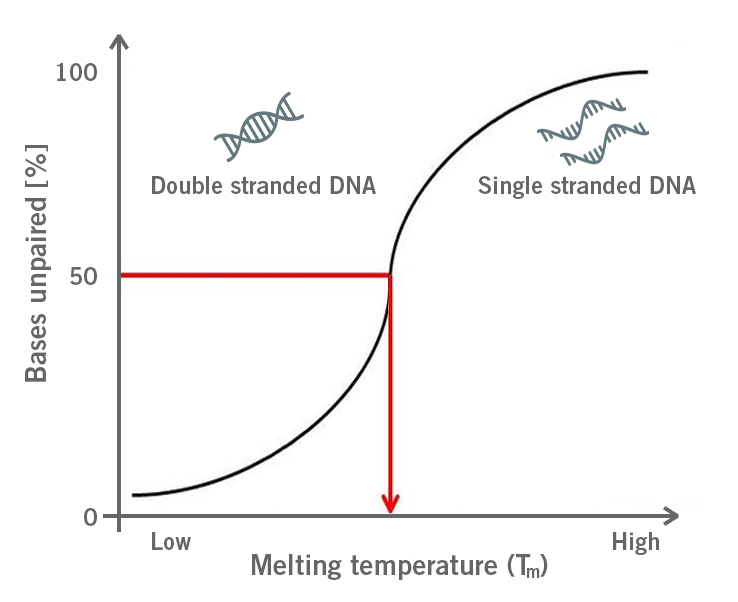
Image 2: Depiction of the primer melting temperature (Tm) at which 50% of the double stranded DNA dissociates into single stranded DNA.
In order to efficiently amplify a DNA sequence, the two utilised primers should ideally have the same Tm, or the temperatures should not differ by more than 2°C. This enables the primers to molecularly binding in sync and produce the best results.
The melting temperature of a primer can be calculated according to the number of nucleotides present or according to the primer’s salt concentration (Na+). The following equations are used to determine the ideal melting temperature:
- Tm = 4 (G + C) + 2 (A + T)
- Tm = 81.5 + 16.6(log[Na+]) + 0.41(%GC) – 675/primer length
No. 3 primer design factor: Choose the appropriate percentage of GC content
The GC content of primers and probes is the percentage of guanine (G) and cytosine (C) in the primer. It is recommended to keep the GC content between 40% to 60% when designing a primer. A primer with a length of 20 nucleotides should contain 8 to 12 Gs or Cs.
The reason for this GC content range is simple. When primers and probes anneal to their target sequence, GC base pairs form three hydrogen bonds and adenine (A) and thymine (T) form two hydrogen bonds (image 3). As three hydrogens bonds are stronger than two, the separation of G and C requires more energy (in the form of heat) than for A and C. A higher GC content in the primer will lead to stronger binding of the single DNA strands (ssDNA), resulting in a higher Tm. This could be an issue during PCR and qPCR, as higher GC content can cause mismatches and the formation of primer-dimers, i.e. the hybridisation of two primers with each other (Kumar & Kaur, 2014; Piovesan et al., 2019).
If the GC content of the primers is less than 40%, their lengths may need to be increased in order to maintain the optimal Tm.
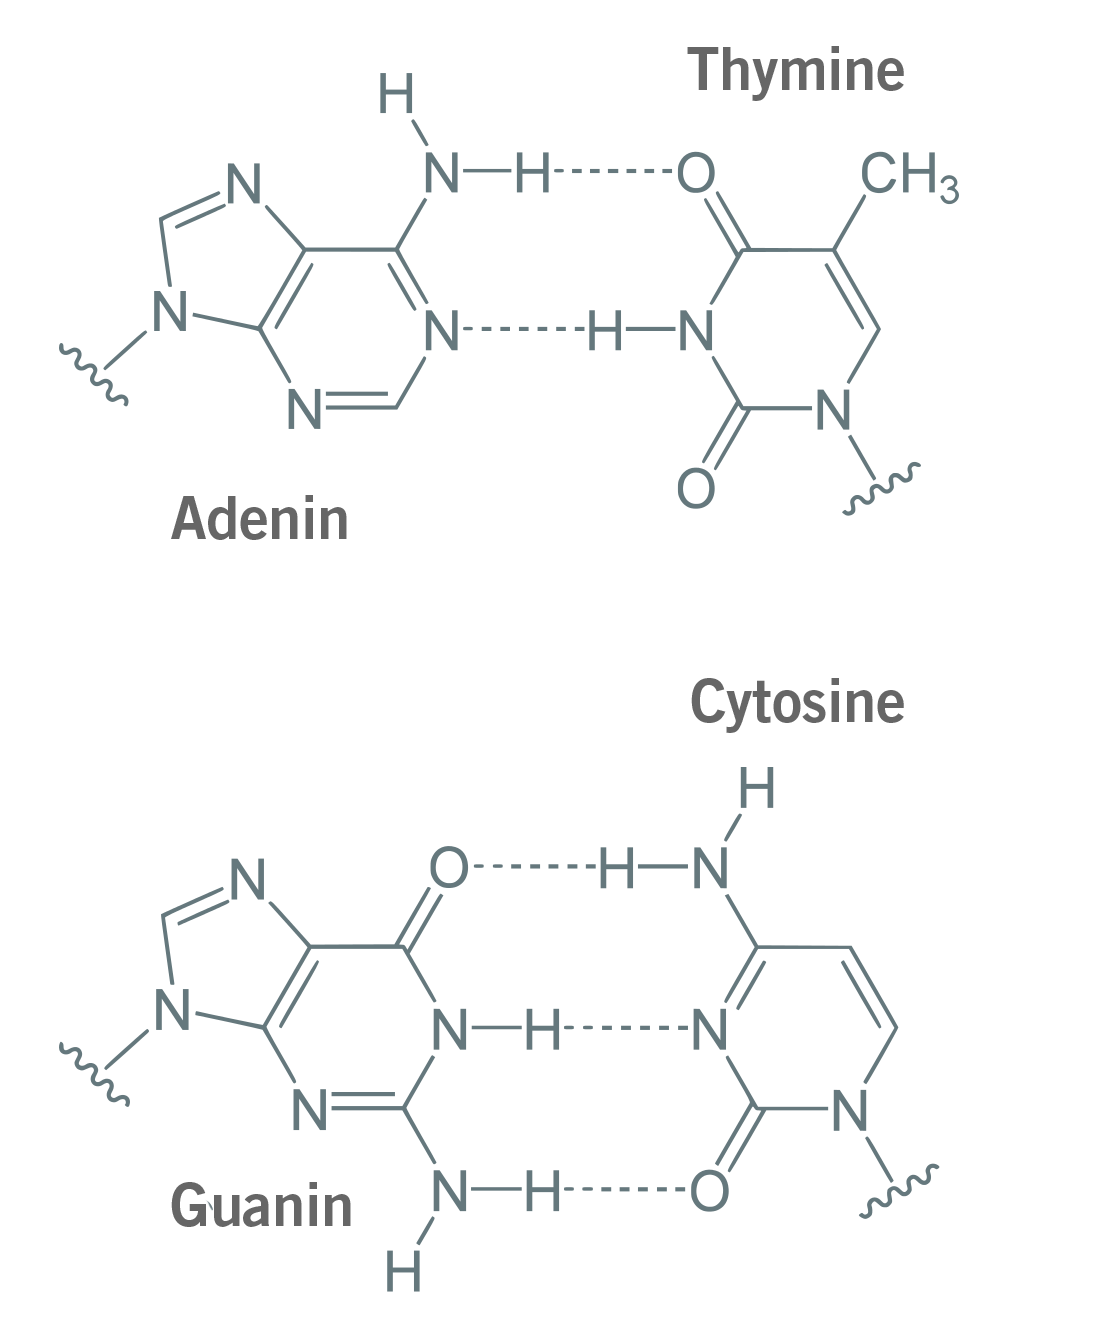
Image 3: Adenine and thymine bind via two hydrogen bonds, guanine and cytosine bind via three hydrogen bonds.
What if the GC content of the primer needs to be higher?
If there are more than two GC residues present in the target sequence, try to find a sequence with an AT residue that separates the GC residues.
Consecutive GC residues should be moved to the centre of the primers. This could contribute to the prevention of secondary structure formation due to steric hindrance.
The GC clamp
The term “GC clamp” refers to the presence of Gs or Cs in the last five nucleotides at the 3′ end of primers (image 4). The benefit of a GC clamp is that it promotes complete primer binding. However, the presence of more than 3 G’s or C’s at the 3′ end of a primer can lead to non-specific binding and false-positive results.
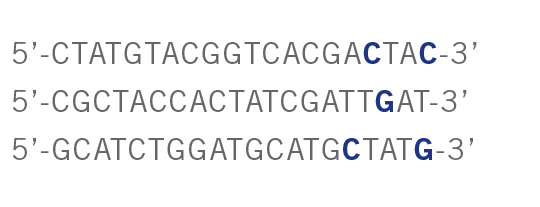
Image 4: Examples of primers with GC clamps (in blue).
For probes, the ideal GC content is between 35% and 60%. Experts recommend this content to promote probe specificity and avoid false-positive results. Probes should not contain a G at the 5′ end, as this could interfere with the fluorescence from the reporter molecule (fluorophore) that is attached to this end.
No. 4 primer design factor: Avoid secondary structures and primer-dimers
Primer-dimers and hairpin loops are two types of secondary structures that can form during PCRs and qPCRs.
Primer-dimers are formed due to the presence of complementary sequences within a utilised primer or complementary sequences shared by two primers. This is represented by the parameter “self-complementarity” in primer design tools. The two types of primer dimers are:
- Self-dimer refers to, for example, the hybridisation of two forward primers to each other due to intra-primer homology.
- Cross-dimer refers to the hybridisation of the forward and reverse primer due to inter-primer homology.
Primer-dimers prevent primers from annealing to the target sequence. Hence, most of the final PCR product is just the amplification of the primers themselves rather than the amplicon.
Hairpins are formed due to the intramolecular interaction of the primer. Here, two regions of three or more nucleotides within the primer are complementary to each other. When they anneal, a hairpin is formed (image 5). The probability of forming a hairpin is represented by the parameter “self 3′ complementarity”. Hairpins can impact the amplification step and lead to non-specific amplicons or even no amplicon yield (Singh & Singh, 2000).
Significantly, hairpins can also form when the annealing temperature is too low.
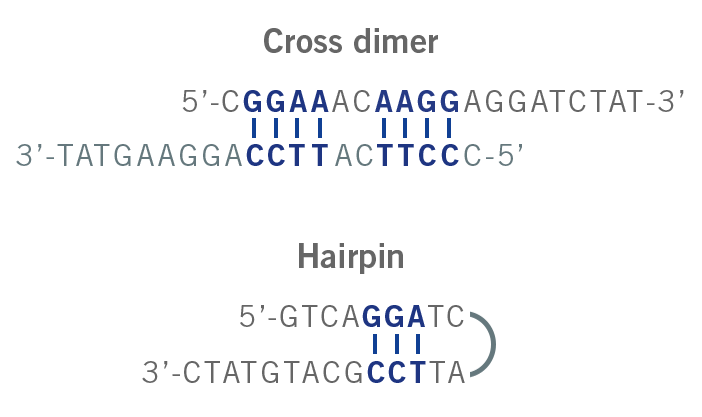
Image 5: Depiction of cross dimer and hairpin formation.
For both parameters (self-complementarity and self 3′-complementarity), the lower the number, the better.
However, secondary structures can be avoided by adjusting the annealing temperature (in most cases, an increase in temperature), avoiding cross homology, and changing the primers or DNA concentration. The DNA concentration should be balanced with the number of cycles required in the reaction to enable the best possible results (Mubarak et al., 2020).
No. 5 primer design factor: Use secure and high-quality design tools
As primers are the centre of PCR and qPCR analyses and determine the outcome of amplification, selecting a trustworthy and reliable primer and probe design tool is crucial.
The Eurofins Genomics design and analysis tools are renowned for their high efficiency, sensitivity, and specificity.
The PCR primer design tool utilises Prime+ (GCG Wisconsin Package) to calculate the optimum PCR primer pairs for a given DNA sequence. The tool allows the convenient input of custom parameters, such as primer criteria and reaction conditions (image 6).
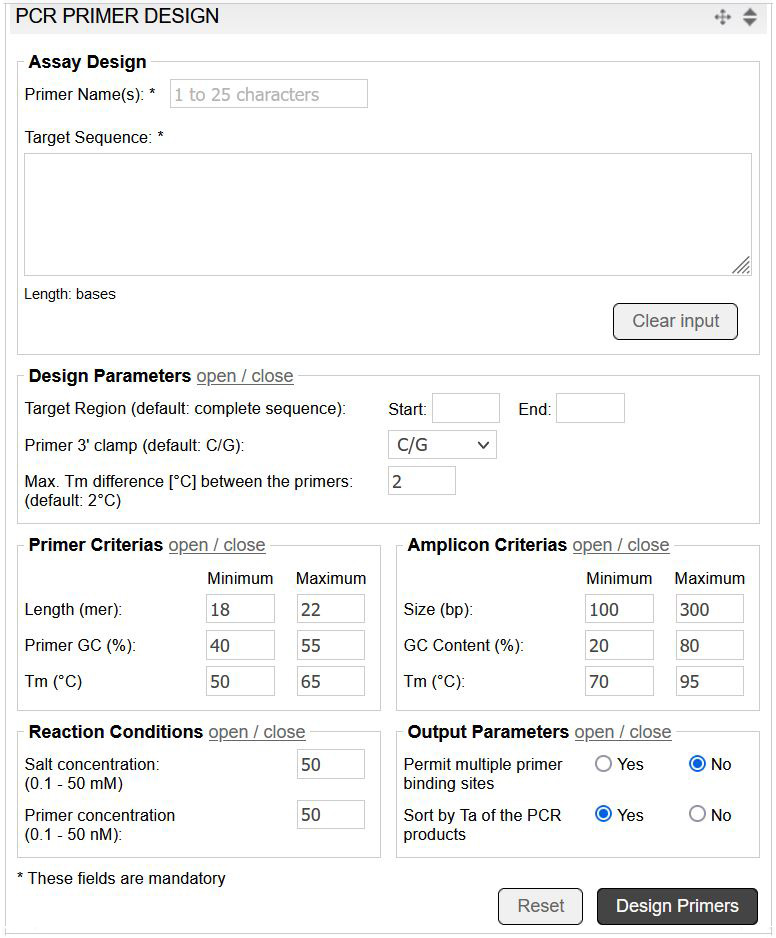
Image 6: Input mask of the PCR primer design tool.
The qPCR assay design tool utilises Prime+ (GCG Wisconsin Package), complemented by additional parameters for probe design. The tool selects the optimum qPCR probes for the entered DNA sequence according to custom parameters (image 7).
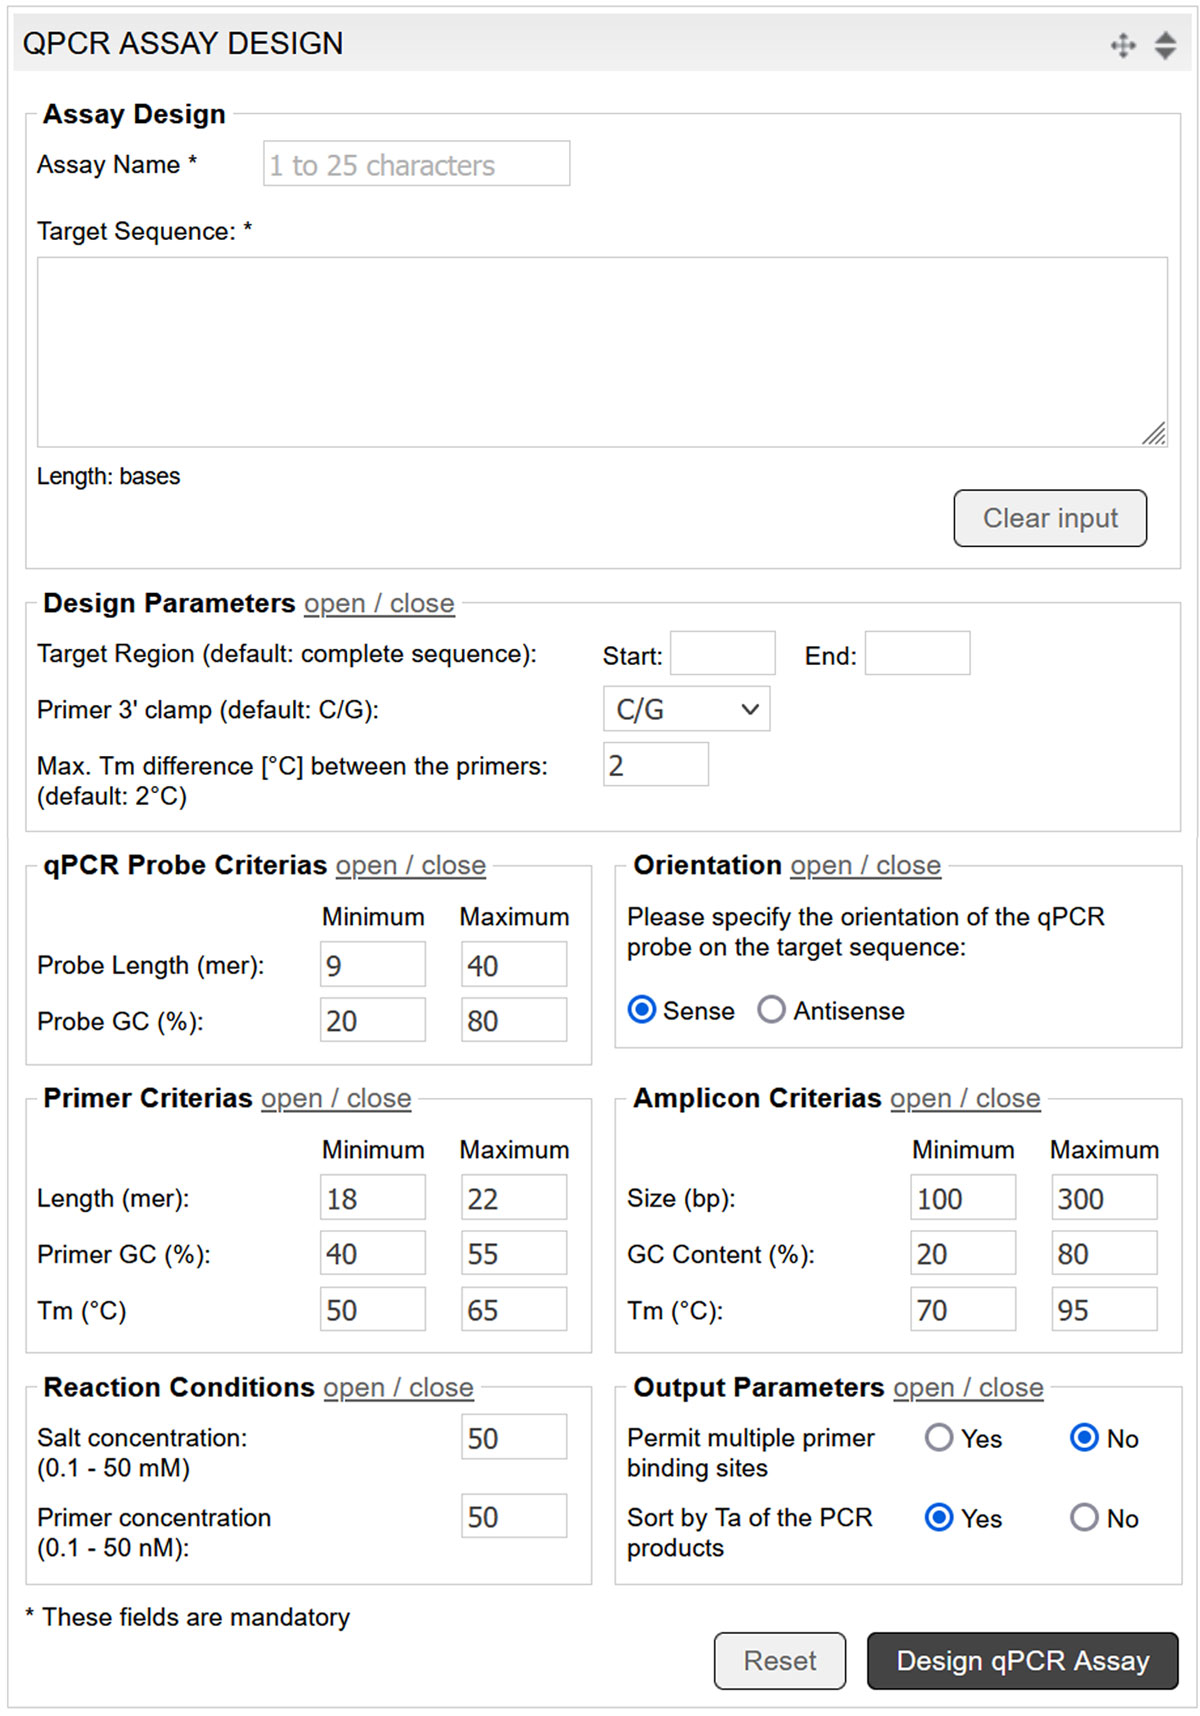
Image 7: Input mask of the qPCR assay design tool.
Alternatively, analyse your oligonucleotides before ordering them, with the Oligo Analysis Tool. The analysis results specify the reverse and complement sequences, GC content, Tm and extinction coefficient, OD and concentration calculations, as well as the probability of self-dimer and cross-dimer formation. Even wobble bases are considered in the analysis.
If the oligo parameters are satisfactory, the oligo can be ordered ordered directly (image 8)
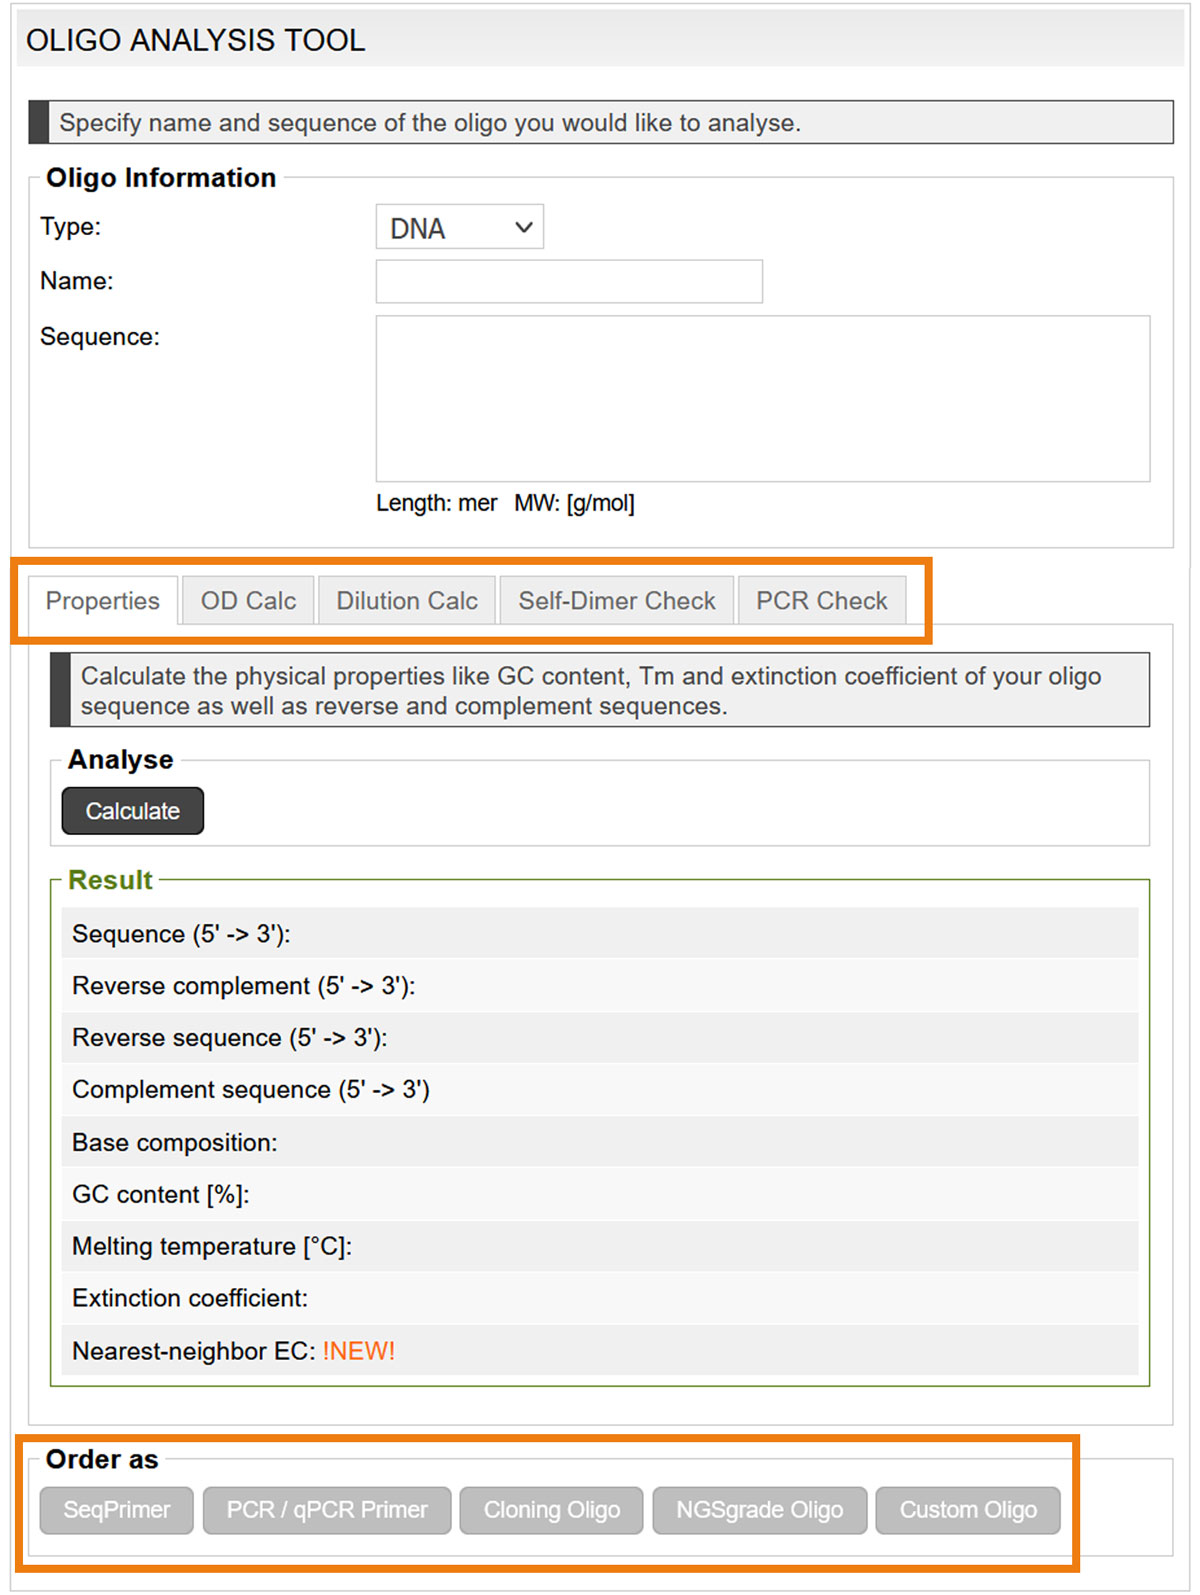
Image 8: Input mask of the oligo analysis tool.
The Eurofins Genomics oligo portfolio encompasses a variety of PCR primers in tubes and plates, qPCR probes, such as LocNA, MGB, dual labeled and LightCycler probes, and other optimised application oligos, such as sequencing primer, cloning oligos, and NGS-grade oligos.

Are you not sure what oligos to choose? See our interactive oligo selection guide and find the oligos best-suited for your project.
By Kanza Javed and Dr. Andreas Ebertz