
Single nucleotide polymorphisms
The bovine genome contains approximately 3 billion base pairs of DNA and 22,000 genes. Even though animals of the same species are approximately 99.9% similar at the DNA level, they possess slightly different qualities, many of which are difficult to observe phenotypically (phenotype = visually apparent characteristics). The difference of 0.1 % mostly consists of SNPs, which describe DNA sequence variations, and repeat elements which contribute to the physical variations between individual animals. In cattle, SNPs occur at around every 700th bp and in total there are up to 4 million SNPs in the whole cattle genome.
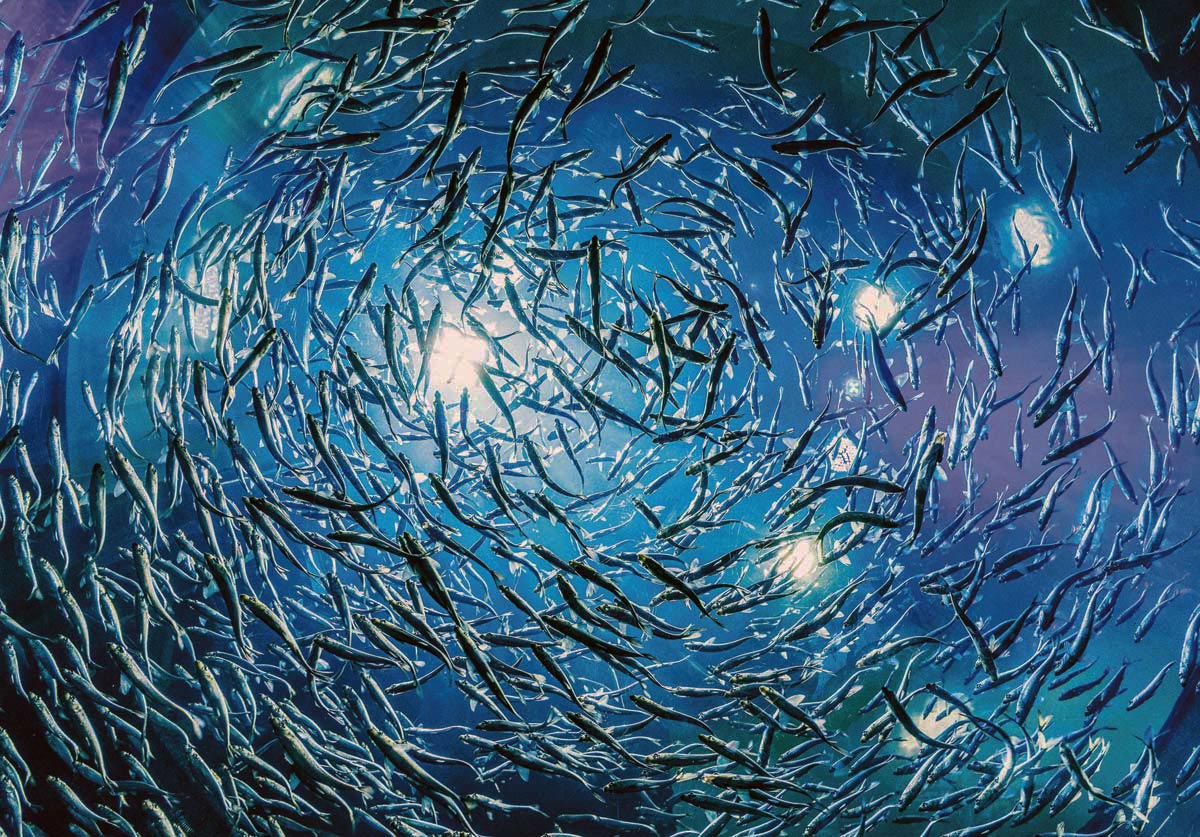
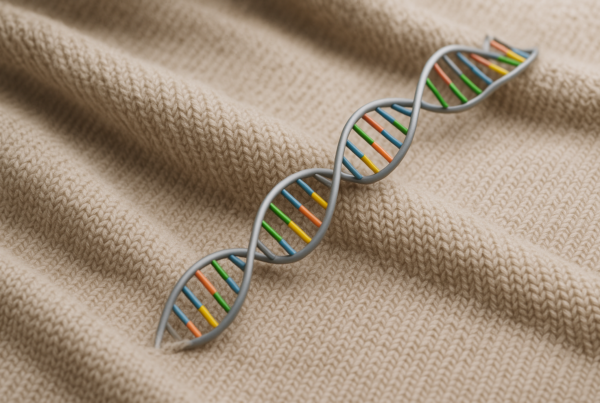
The individual SNP profile of an animal (image 1) refers to its genetic map with the occurrence of certain SNPs that are linked to favourable agricultural traits (Seidel, 2009).
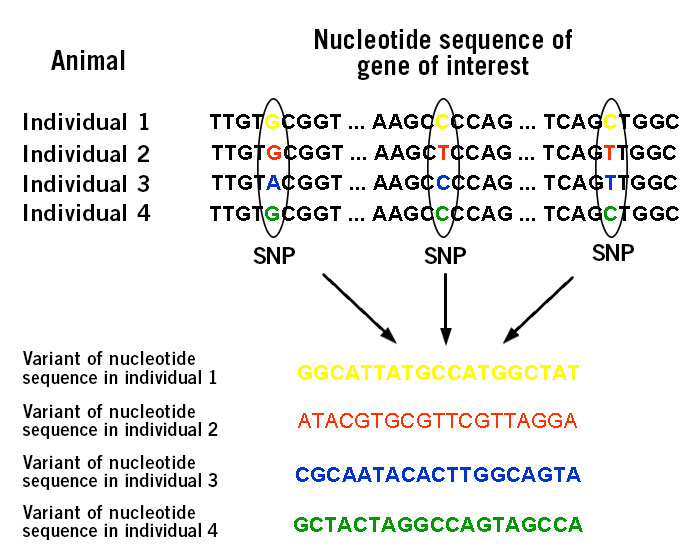
Image 1: Depiction of variations in nucleotide sequence within a specific gene based on single nucleotide polymorphisms (SNPs).
Traditionally, cattle were selected and bred based on their phenotypical characteristics. At the turn of the 21st century, a major leap was made by applying genomic selection based on SNP analysis in dairy cattle. This approach immensely contributed to a doubling in dairy cattle performance (image 2a). For instance, the SNP profile of Holstein dairy cattle (image 2b) is well-characterised, and presently routinely utilised in selective breeding programmes to improve performance in traits such as milk yield, milk protein content, fertility, and ease of calving. Furthermore, ongoing research into identifying the genetic cause of inherited disorders has improved the overall health and wellbeing of livestock.
In 2007, the sheep and goat genomes were sequenced, enabling the generation of SNP microarrays that are now used for SNP profiling and subsequent selection of individual sheep and goats for improved meat, wool and dairy production. SNP microarrays for pig profiling are also available and become more widely used in selective breeding programmes (Kneeskern, 2016; Whittier, 2018).
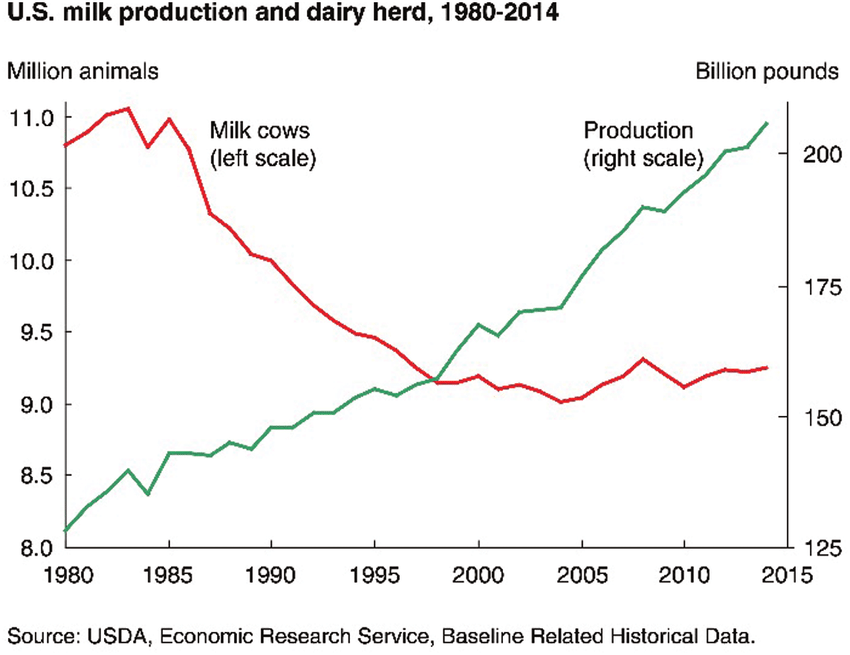
Image 2a: Changes in dairy production in the U.S. from 1980 to 2014. Increased milk production is accompanied by simultaneous reduction in number of cattle.
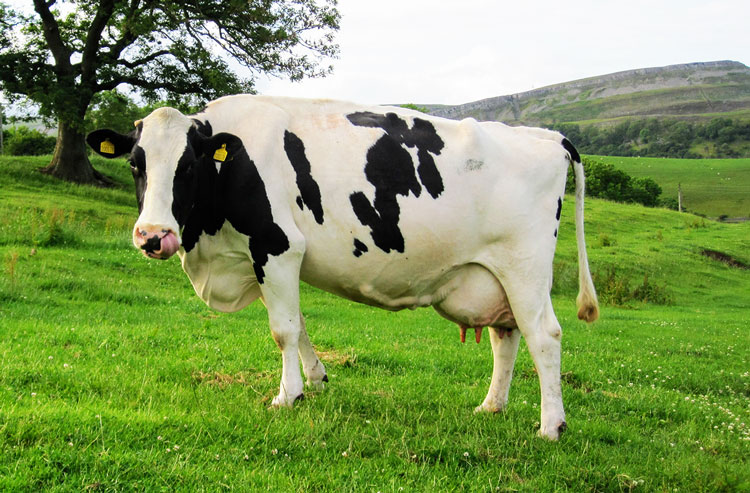
Image 2b: Holstein dairy cattle.
Based on the outstanding success of genomic selection in dairy cattle, the same approach is now employed for animals in aquaculture to aid fish breeding for improved growth, thermal tolerance, lipid metabolism, resistance to diseases and other beneficial qualities.
The beginnings of blue biotechnology
Aquaculture dates back to ancient China around 4000 years ago. The Chinese used to raise fish such as carp in rice paddies. However, written records about the specific aquaculture practices from that time do not exist anymore. In 500 B.C., a Chinese man named Fan Lai penned down the book titled “The classic of fish culture” to teach people the basics of raising fish as food. Even though the pace of innovation in aquaculture has been slow, a blue revolution finally started in the 1880s when people expressed interest in raising trout, salmon, or oysters.
In 1899, an international conference on marine research was held in Sweden and delegates from around the world attended. This conference encouraged the establishment of fish hatcheries and marine laboratories to address the growing concern of declining fish stocks (The international conference for marine research, 1899). In the official yearbook of the Commonwealth of Australia, published in 1913, it is stated that “the collection and distribution of the knowledge of the world’s work in fish-culture would make an acre of water more valuable than an acre of land” (no pun intended) (Archer, 1969).
In 1924 in Kenya, people were farming Tilapia, a genus of cichlid that is quite disease-resistant, tolerates poor water quality and grows and reproduces quickly.
In 1970, the use of hormones for sex reversal in fish was introduced in aqauculture. The use of monosex fish cultures eventually overcame the problem of fast reproduction in Tilapia. Fast reproduction had lead to overcrowding, enhanced competition and stunted growth in Tilapia (Penman & McAndrew, 2000).
Meanwhile, a Japanese scientist, Motosaku Fujinaga, was working on artificially spawning and hatching shrimp in a tank. By 1967, he was able to produce 1.5 million shrimps in a 10 x 10 meter tank (Chamberlain, 2010).
Trygve Gjedrem, a Norwegian scientist, was a pioneer of aquaculture genetics. In 1971, he introduced a breeding program for fish. Over four years, he isolated salmon from 41 different rivers and selectively bred them in order to produce full and half-siblings. He found that generally one to three strains with favorable traits dominated his aquaculture populations. He then selected those for further breeding and eventually established the offspring for aquaculture production (Gjedrem et al., 1991).
These are examples of the many accomplishments in aquaculture. However, they raise a profound question: Why did it all happen that late? After all, humans had domesticated cattle since the neolithic age, about 7,000-10,000 years ago (Ajmone-Marsan, 2010; Nash, 2010).
As with any other field, the success of one technology is deeply interlinked with the advancement in other technologies, and biotechnology is the driving force that accelerates blue biotechnology to the next stage of performance and safety.
Microarrays and quantitative PCR (qPCR) (image 3), have been proven to be effective and groundbreaking solutions for the field of aquaculture.


Image 3: Examples of different microarrays and a qPCR cycler.
Challenges in blue biotechnology
In human history, protein intake mainly depended on the successful hunting of game animals and, where possible, catching of fish. Fish is a rich source of high-value protein, micronutrients and essential fatty acids such as Omega-3.
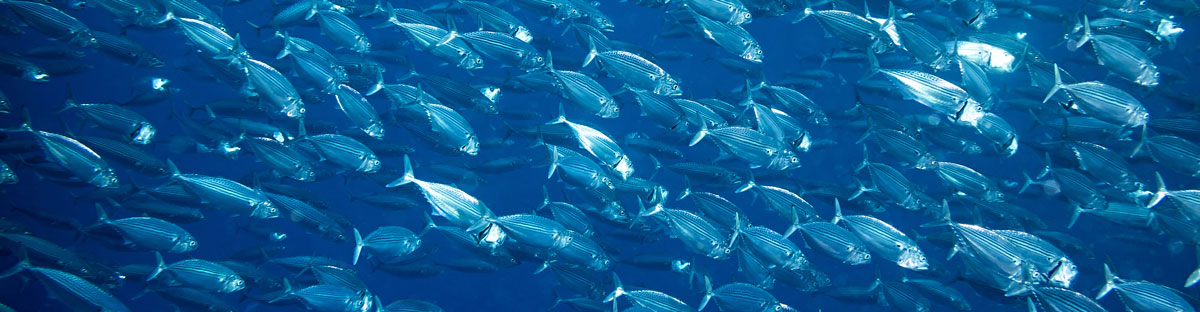
Similar to meat, the worldwide demand for fish products is steadily increasing. Each year, commercial fishing yields approximately 77 billion kg of fish from the oceans. Continued fishing at this rate will inevitably lead to a collapse of marine biodiversity. The oceanographer Sylvia Earle said, “We think of fish as free goods, there for us to extract, not really thinking about what is taken out of the system“ (Stanton, 2019). Rearing fish in aquaculture is the only sustainable solution to meet the needs of a growing population. There are two forms of aquaculture: freshwater aquaculture and mariculture.
Freshwater aquaculture is simply the controlled cultivation of aquatic organisms in a defined area (image 4). The biomass of fish produced per unit surface area is much greater than that of the biomass of terrestrial animals.
In mariculture, aquatic organisms are cultivated and managed in their natural environment such as the ocean and estuaries (image 4). This rearing method contributes to reducing the production pressure on land resources.
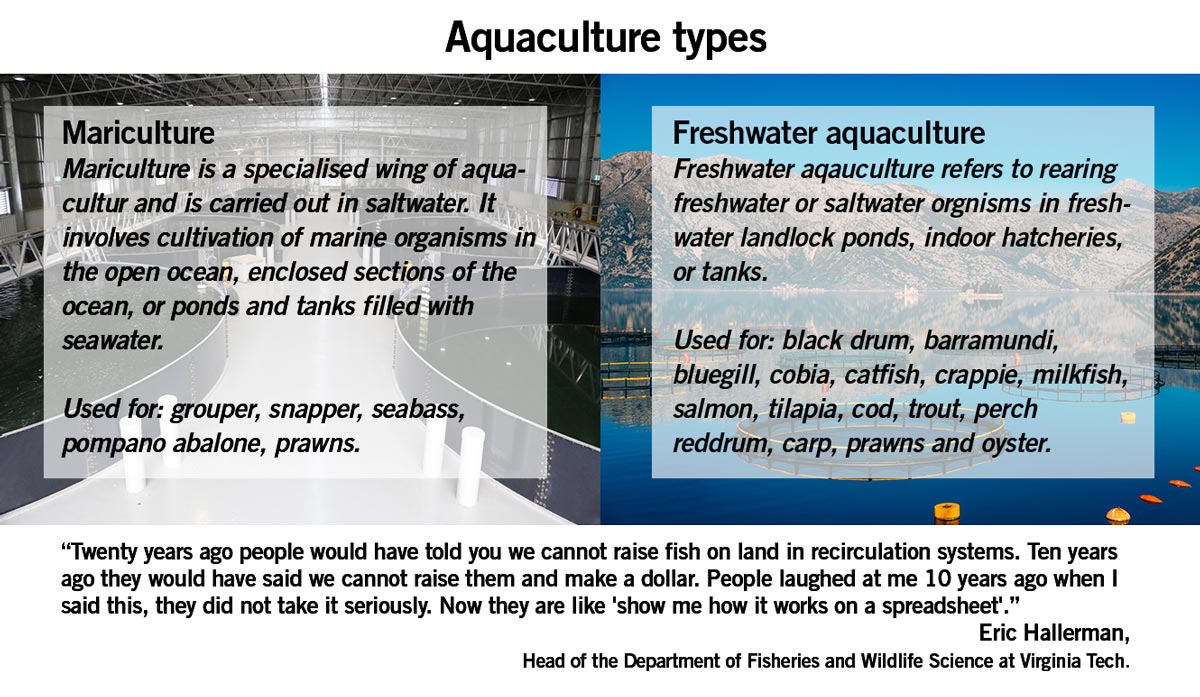
Image 4: Differences between mariculture and freshwater aquaculture.
Rearing fish in freshwater aquacultures represents somewhat unnatural conditions and brings its own challenges. The prime challenges are (Biswas & Maurye, 2017):
• Reduced survival
• Reduced fish growth
• Reduced genetic diversity
• Reduced feed conversion
• Reduced disease resistance
• Reduced environmental adaptation and reproduction
These challenges can be addressed by breeding fish with better adaptations and a desirable genetic makeup for farming. For that purpose, fish farmers have increasingly utilised microarrays for gene expression analysis to improve their breeding and production efforts in recent years.
Benefits of microarrays for blue biotech
In general, the survival of a species depends on genetic variability and the natural population is the best source of genetic variation. In the past, the selection process in fish breeding was based on the phenotype (visually apparent characteristics) of individual fish. For instance, selecting a fish strain with higher weight or more delicious taste may appear as the right strategy, but it is not necessarily always the case. The utility of certain traits that are expressed by any organism is based on the genetic makeup to a large extent, but also depends on the environment. Therefore, it is possible that a fish that performs well in the ocean may perform poorly in a fish farm environment. This phenomenon is called fitness.
Also, the mere presence of a favourable gene variation in an organism is not enough to predict its performance. The more important question is to determine if the message encoded by the gene is being expressed (gene expression) and not surpressed in a given environment. Functional genomics approaches and microarray analysis have now enabled breeders to analyse the animals’ SNPs and gene expressions in any given environment. This can further refine the selection process for breeding.
Example:
Take two fish: A high-performing fish and another low-performing fish, and measure which genes are responsible for high performance (via SNP profiling). The identification of these genes allows fish farmers to then compare the expression of the genes of interest over a wide range of environmental conditions (image 5). This information assists in strain improvement programs and commercialising aquaculture models in any environment of choice.
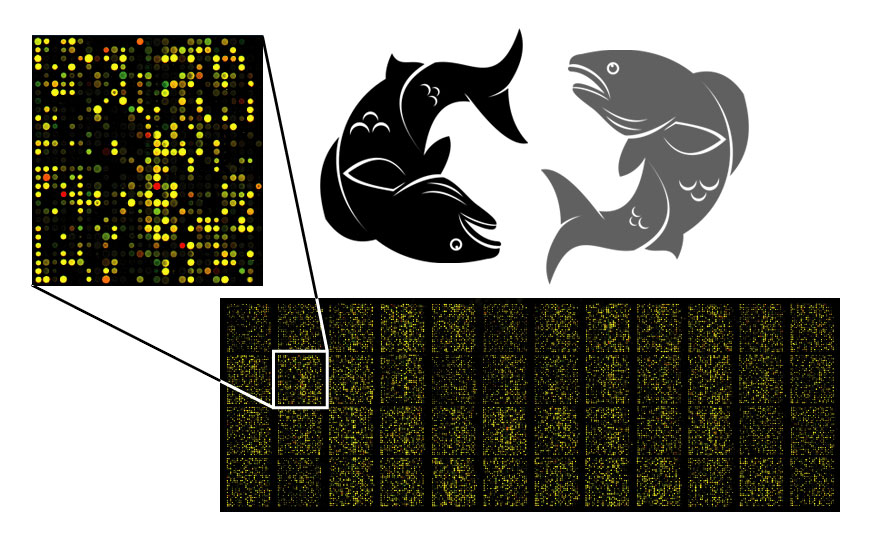
Image 5: Depiction of microarray fluorescence analysis.
Microarrays: How they identify SNPs and measure gene expression levels
1. Use of DNA microarrays to generate SNP profiles of organisms
Favourable traits in animals are determined by the interaction of a rather wide range of genes. In order to understand the variation within respective genes they need to be sequenced. However, sequencing can become expensive when applied across large sample sets. Therefore, a more budget-friendly approach is to analyse the SNPs, the small changes in genes that are responsible for the variations between individuals.
SNP microarrays can read thousands of SNP markers in an animal’s DNA at low cost. For instance, in the catfish genome a SNP occurs at around every 93rd bp. The most abundant and informative SNPs are chosen for the construction of the SNP microarray. This commercialised microarray is then used to profile specific catfish in order to select them for breeding. Similarly, microarrays for other fish species such as atlantic salmon, common carp and rainbow trout have been developed (FAO, 2017).
Principle of SNP microarrays
An SNP microarray consists of a glass slide upon which specific DNA fragments are fixed. The fixed DNA fragements are called probes. This microarray follows the principle of DNA hybridisation in which a single base change (SNP) can be detected through fluorescence.
The SNP analysis process starts with the extraction of DNA from fish samples. The extracted DNA is purified and fragmented, and then amplified via PCR. The generated DNA fragments are labelled with a fluorescent dye and applyed to the SNP microarray, where they hybridise with the probes fixed to the glass. Significantly, the sample DNA fragments only bind to the probes when they find their exact complementary match, i.e. a DNA fragment has to contain a specific SNP to hybridise to the complementary probe that contains the same SNP. Subsequently, the hybridised DNA emits a fluorescence signal that is detected and used for analysis and to generate the SNP profile (image 6).
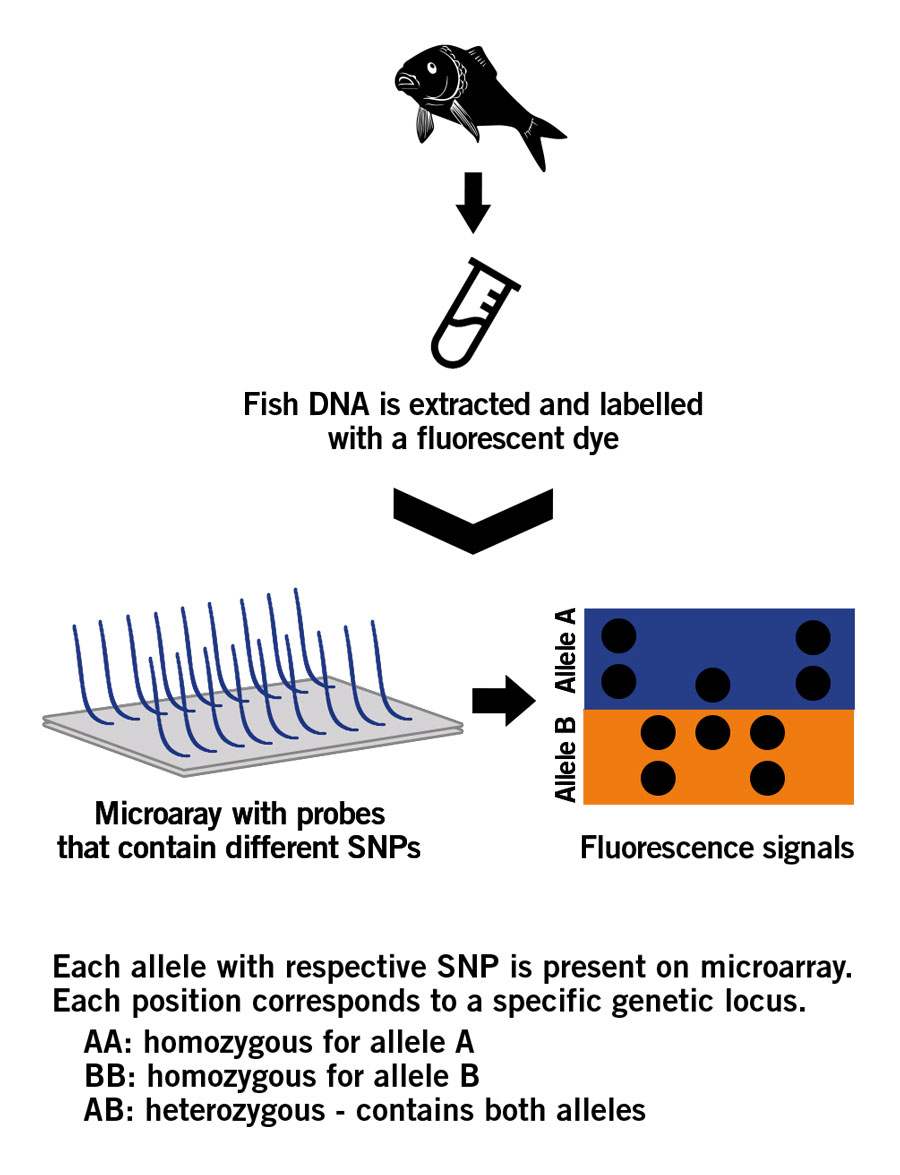
Image 6: Principle of a SNP microarray.
2. Use of DNA microarrays to simultaneously measure the expression of genes
The activation of gene expression in an organism is, in parts, highly specific and depends on certain biotic and abiotic environmental factors. As individual animals are different and react differently to environmental factors, they also differ in the expression of their genes. Some animals will show characteristics of improved adaptation or performance in a given environment and others will not. Comparing the gene expression in different fish strains can support the selection of specific traits for breeding applications.
For gene expression analysis (RNA), there are two main types of microarrays: High-density microarrays and customised cDNA microarrays.
High-density microarrays are ready-to-use and contain a large number of selected genes or expressed sequence tags (EST) fragments. These genes and ESTs (probes) covering the chip either represent the entire transcriptome, or only selected genes of a species. They are arranged on the chip in a way that the location of each fragment is known
The mRNA that is isolated from fish using a tissue or blood sample has to be converted into cDNA as RNA is fragile and degrades easily. After this so-called reverse transcription, the cDNA is cut into fragments by using restriction endonucleases. The cDNA fragments are labelled with fluorescent dyes and applied to the microarray. Subsequently, the cDNA fragments bind with the probes on the microarray based on their complementarity. The following fluorescence signal analysis allows for the comparison of gene expression patterns between individual fish. The results can beused to identify genes for traits such as disease resistance, improved growth and environmental adaptation (Govindarajan et al., 2012).
Customised cDNA microarrays consist of a glass slide plotted with synthetic oligonucleotide fragments of choice. These probes are designed according to the specifications and therefore research questions of the fish breeder. The probes can be specific for sets of genes that are associated with pathogen resistance in a certain fish species for instance. The high degree of customisation allows for very specific gene expression investigations.
The choice of microarray depends on the demands of the project. If you are analysing specific traits and characteristics in a breeding setting, SNP microarrays are ideal for this purpose.
If you are analysing specific pathways or biological processes, a customised cDNA microarray for your genes of interest could be the most suitable strategy.
Are you conducting a comprehensive gene expression study in a popular species? A high-density microarray pre-designed for your species of interest could be the best approach. In contrast to customised cDNA microarrays that require a reverse transcription of RNA into cDNA, high-density microarrays only require small amounts of RNA (Zhang et al., 2009).
Contact our genomics expert to discuss your project requirements and design options.
Example:
A fish species is raised in two distinct environments: High oxygen (group A) and low oxygen (group B). Microarrays can be used to determine the effect of the different environments on the desirable traits of the fish. For this purpose, a customised cDNA microarray is designed that contains the genes associated with the desirable traits. The RNA of both fish are isolated and reverse transcribed into cDNA. cDNA of group A fish is labeled with green fluorescent dye, while cDNA of group B is labeled with red fluorescent dye. The samples are pooled together and applied to the microarray. Genes expressed in both fish groups will bind equally to their respective plotted genes or ESTS that act as target conterparts on the microarray. This will ultimately produce an overall yellow image (green + red = yellow). However, the genes that are only expressed in group A fish will appear green on the chip. Similarly, genes only expressed in group B fish will appear red on the chip. These differences in fluorescence signals are analysed using advanced BioIT software (image 7) (Roy, 2017). The results then provide information about the genes that are associated with improved tolerance for water with low oxygen levels. Eventually, this information aids the breeder in the subsequent breeding decisions.
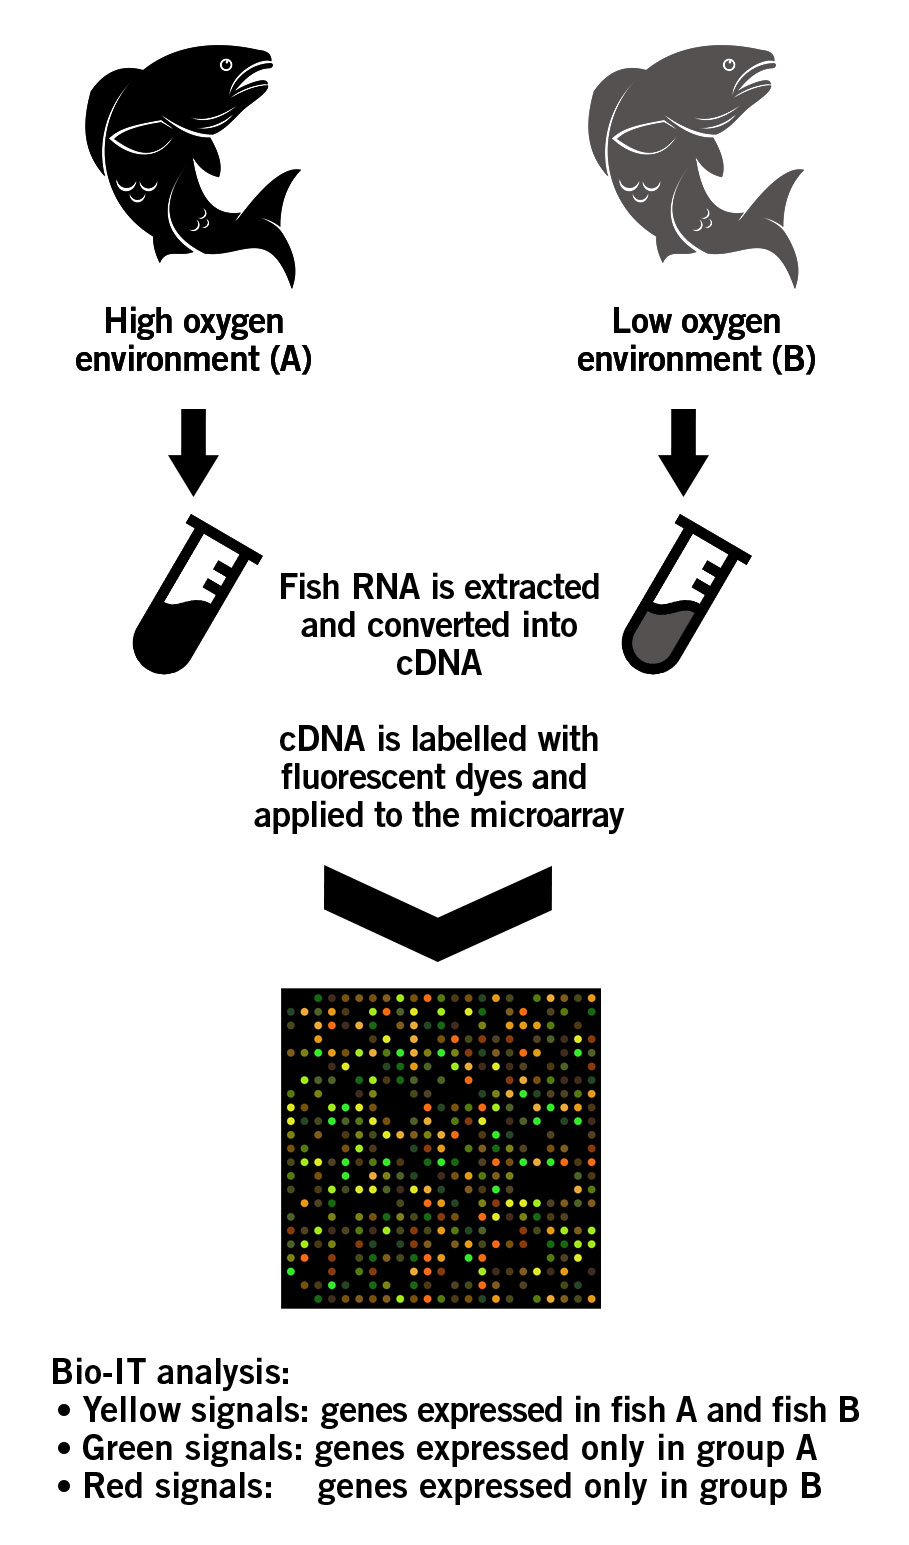
Image 7: Principle of an cDNA microarray.
Microarrays: Applications in blue biotech
Microarrays support the selection of fish with desirable traits: Improved growth, survival, diseases resistance and adaption to the environment. Consequently, identification of desirable genes can enable successful selection, interspecific hybridisation, and breeding. Traditional breeding and selection approaches rely on a small number of phenotypical traits to predict genotypes. Microarrays, on the other hand, provide a measure of thousands of new traits.
Micoarrays: Solving issues in breeding
Expression profiling of Sparus aurata (Gilt Head Bream) has facilitated the species’ use in aquaculture. Customised cDNA microarrays were used to determine the change in gene expression in response to cortisol injections in order to stimulate stress. It was found that various stress genes were activated or repressed in response to the cortisol treatment. Consequently, different stress-response-associated pathways were found to be upregulated or down-regulated, such as the down-regulation of intracellular iron levels, which are associated with growth suppression (Sarropoulou et al., 2005).
Hormones are exploited in aquaculture for reproduction and sex reversal. However, as described for cortisol, the use of hormones could induce stress responses in fish. For this reason, the European Union discourages the use of hormones and antibiotics to minimise the negative effect on biodiversity (Seas at risk, 2014). Nevertheless, microarrays can be utilised to determine whether the use of a specific nutrient or hormone will be suitable for the fish at a specific moment. In commercially valuable fish species such as Halibut (genera of Hippoglossus and Reinhardtius), the use of gene expression profiling via microarray contributed to solving production problems. Specifc challenges of fish metamorphosis stages such as arrested metamorphosis, feeding difficulties, abnormal pigmentation and reduced growth are now much better understood and treatable (Campinho et al., 2012; Inbakandan, 2020).
The first SNP microarray designed for Atlantic salmon has enabled researchers to investigate the genetic differences between wild and farmed Atlantic salmon (Wenne et al., 2016).
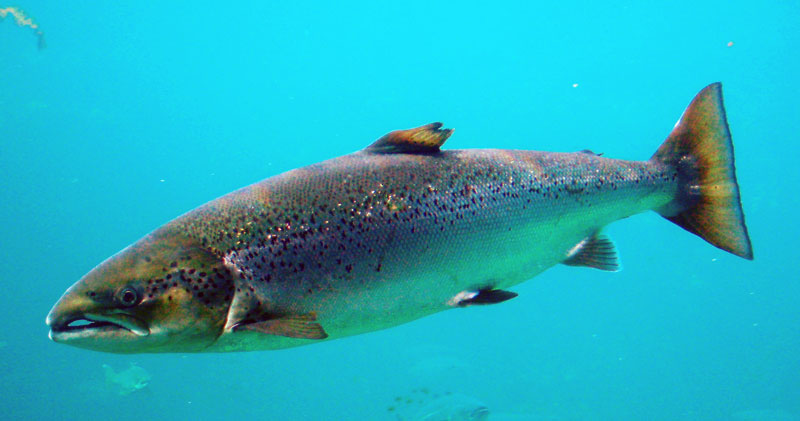
Image 8: Salmo salar (Atlantic salmon)
Micoarrays: Identification of disease resistance genes
Scientists working in Japan have constructed a microarray containing more than 200 immune-related genes. They transfected juvenile olive flounders with a plasmid expressing viral proteins from haemorrhagic septicaemia virus (VHSV) and measured the expression profile of infected and uninfected olive flounders. They successfully identified genes responsible for a strong immune response (Zhang et al., 2009).
Piscirickettsia salmonis is a bacterium that infects salmon and causes extremely high mortality rates in salmon populations, leading to substanial economic losses. Researchers in Chile used salmon with varying susceptibility to P. Salmonis to analyse the differences in their gene expression profiles. The researchers identified several genes that confer disease resistance. One of these genes provides disease protection by iron deprivation, as many pathogens need iron for reproduction and growth. In short, the study identified immunity-associated genes for future treatment strategies (Pulgar et al., 2015).
SNP microarrays have recently been applied in a disease resistance breeding programme. A research group working in China created a SNP microarray that contains 48,697 SNPs linked to disease resistance for the selection of disease-resistant Japanese flounder (Zhou et al., 2021).
Micoarrays: Identification of genes for environmental adaption
Although the genome sequence of an organism remains largely the same between individuals, variations in the external environment can lead to variations at the gene expression level. The effect of abiotic environmental factors (external stimuli) that influence fish growth, such as oxygen level or water temperature, can be identified using microarrays (Zhang et al., 2009). Here, microarrays are a vital tool that help scrutinise the relationship between genotype and phenotype. For instance, during development, teleosts are exposed to a plethora of environmental stimuli. These stimuli are part of the fish’s early life history that has been shown to directly affect the success of the fish. Therefore, it is important to determine the effect of various external stimuli on performance during fish development via microarrays to select the best-suited parameters for production on a commercial scale (Zhang et al., 2009; Sarropoulou et al., 2016).
Importantly, the transcriptome (represented by the entirety of cDNA) is directly linked to the functional regions of the genome. Specifically designed SNP microarrays that utilise cDNA are, therefore, informative about the adaptation of the fish to environmental cues (Kumar et al., 2019).
Micoarrays: Fish microbiome and pathogen detection
Genetic characterisation of certain fish strains has optimised their commercial production. However, little attention has been paid to the role of the microbiome in fish health and productivity.
There are both beneficial and harmful microbes in nature. Beneficial microbes play a vital role in nitrogen cycling, waste removal or act as probiotics for fish. Especially, the microbiome associated with the skin and the gut contributes greatly to health and disease resilience in fish. Disruption of these microbial communities (dysbiosis) has been shown to have adverse consequences (Webster et al., 2021).
On the other hand, certain microbes can be pathogenic and harm fish. Sometimes even healthy-looking fish can carry pathogens that can spread rapidly in closed-cultured environments. A highly efficient method to profile the detrimental microbes is by microbiome analysis. The results give a comprehensive overview of the present microbes and their quantity ratio, and pathogens can be identified easily. A further analysis targeted at the present pathogens can be used to assess the source of the pathogens, the extent of their spread and the severity of infection. Here, the method of choice is quantitative PCR (qPCR) analysis.
With qPCR analysis, fewer genes of interest can be selected and their expression profile across a period of time analysed. qPCR is an excellent tool for low cost, rapid, sensitive and specific detection of pathogens, which could be crucial for monitoring and disease prevention in aquacultures (Austin, 2019).
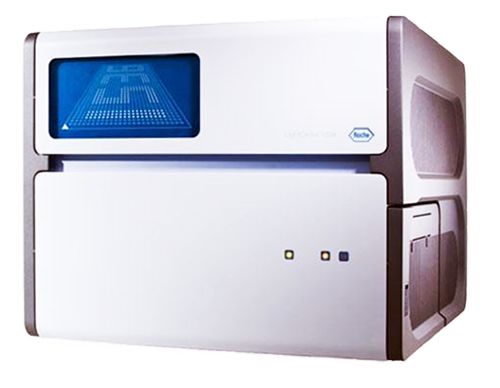
Image 9: qPCR cycler
qPCR: How it can be used to measure gene expression
qPCR is a molecular biology technique that relies on Watson and Cricks’ base pairing rules. Three essential steps formulate the process of PCR.
- Denaturation is the first step. Double-stranded DNA is converted into single-stranded DNA.
- Small oligonucleotides, called primers, bind to the single-stranded DNA in the annealing step of PCR.
- The last step involves the addition of deoxynucleotides to the primers facilitated by DNA polymerase.
All these steps are repeated over and over again until a detectable amount of target DNA has been amplified, which can then be quantified. This technique can be utilised to specifically detect the presence of certain bacteria, fungi and viruses via the presence of their unique nucleic acid (DNA or RNA) sequences in a sample. qPCR also semi-quantifies the initial concentration of microorganism-specific DNA/RNA in the sample. qPCR can therefore be applied to aquaculture to both measure the diversity within the microbiome as well as the presence of pathogens in fish or the aquatic environment.
qPCR: Applications in blue biotech
For the production of high quality fish, it is necessary to monitor the microbiomes of fish and the environment, as these contribute to the water quality and fish health.
Microbiome analysis is performed for water from the aquaculture tank or samples directly from fish tissue. Netzer and colleagues, for instance, classified the main bacteria present in a salmon aquaculture that led to performance problems. They collected 200 ml water from the tank and extracted the bacterial DNA. qPCR analysis identified sulfur-reducing bacteria in the water sample that produced hydrogen sulfide (H2S). H2S is both toxic and corrosive and poses a risk for animals in aquacultures (Netzer et al., 2021).
Additionally, qPCR assays can be designed to specifically detect certain potentially harmful bacteria. The bacteria Aeromonas, Vibrio, Edwardsiella and Streptococcus, for example, are associated with causing disease outbreaks in aquacultured fish. A team of researchers in China has developed a qPCR assay that can identify four pathogenic bacterial genera simultaneously in one reaction. For this purpose, they used genus-specific primers. They proved this approach to be efficient, sensitive, and specific (Zhang, et al., 2014).
qPCR is an excelent tool to specifically identify harmful microbes, and, based on this information, take effective and tailored countermeasures.
Are you working in the field of aquaculture and want to improve production, select new traits, or monitor the health of your stock? Contact our dedicated Agrigenomics expert to discuss how our tailored SNP microarrays, high-throughput genomics solutions and tailor-made solutions for assay development can help advance your breeding and production goals.
By Tamseel Fatima and Dr Andreas Ebertz
Did you like this article about the use of microarrays in blue biotechnology? Then subscribe to our Newsletter and we will keep you informed about our next blog posts. Subscribe to the Eurofins Genomics Newsletter.
3 Comments